Problem Statement:
In the rapidly evolving high-tech sector, staying ahead of the curve is crucial. A leading tech firm invested heavily in training its employees on the latest technologies and methodologies. However, they struggled to quantify the return on investment (ROI) of these training programs, making it challenging to justify further investment or to refine training strategies.
Our Approach:
We began by consolidating data from various sources, including training records, employee performance metrics, project deliverables, and financial data. With this consolidated dataset, we set out to correlate training activities with tangible business outcomes. Using advanced analytics, we aimed to identify patterns and trends that would provide a clear picture of the training’s effectiveness.
Tools Used:
- Power BI for data visualization
- Python (Pandas and Scikit-learn) for data processing and modeling
- SQL for database management
Outcome:
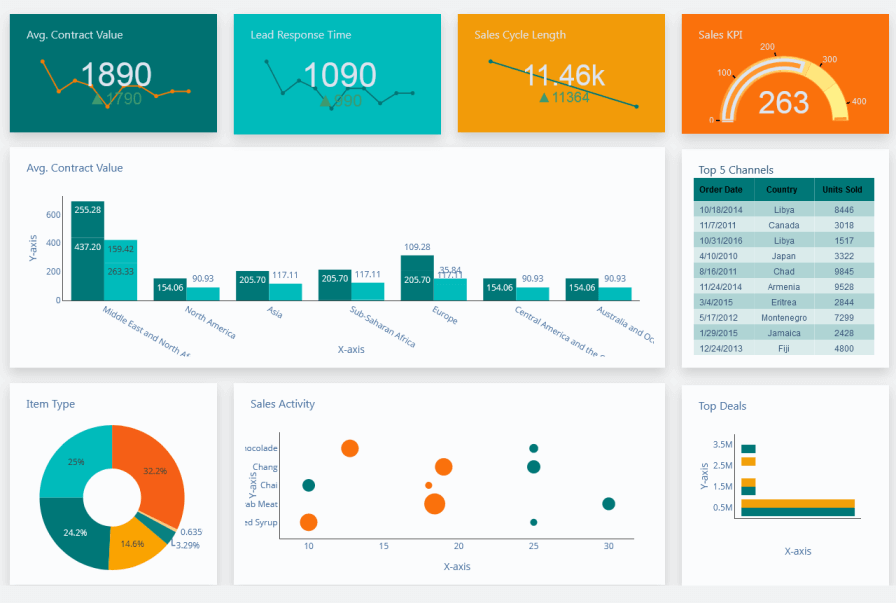
Our team developed an interactive dashboard that visualized the direct and indirect impacts of training on business performance. Key insights included:
- A 20% increase in project efficiency among teams that underwent advanced training.
- A significant reduction in employee turnover among those who attended regular training sessions.
- Clear ROI values for each training module, allowing for better budget allocation in the future.
Blogs
Data Collection and Visualization for Non-Profit Organizations
Data Collection and Visualization for Non-Profit Organizations In today’s digital age, data is often referred to as the new oil. It provides organizations with insights,

The Integral Role of Security in Data Visualization: A Guide by Nvirse
The Integral Role of Security in Data Visualization: A Guide by Nvirse In today’s digital landscape, data visualization is more than just presenting numbers—it’s about

How Data Visualization Amplifies the Non-Profit Mission
How Data Visualization Amplifies the Non-Profit Mission In today’s fast-paced digital world, the adage ‘a picture is worth a thousand words’ has never been more

The Importance of KPI Focused Dashboards, in Tableau; Enabling Informed Decision Making
The Importance of KPI Focused Dashboards, in Tableau; Enabling Informed Decision Making In todays data driven world organizations of all types including non profits and

Data-Driven Impact: Unleashing the Power of Visualizations for NGOs
Data-Driven Impact: Unleashing the Power of Visualizations for NGOs As the world progresses in every aspect, communication should also improve among groups. So, effective communication

Making Every Data Point Count: Enhancing NGO Efficiency with Analytics
Making Every Data Point Count: Enhancing NGO Efficiency with Analytics As the world gets more competitive and convenient every day, the need for data analytics

